IntelliJ IDEA
IntelliJ IDEA
By Hamlet DArcy
17,034 Downloads · Refcard 11 of 185 (see them all)
Download
FREE PDF
The Essential IntelliJ IDEA Cheat Sheet
IntelliJ IDEA
ABOUT INTELLIJ IDEA
Software developers know the importance of using the best tool for the job. Often this means choosing a world-class integrated development environment (IDE), which JetBrains IntelliJ IDEA certainly is. But the best developers don't just have the right tools, they are experts in those tools. This is a guide to becoming that expert. The basics of navigating and understanding IDEA are covered; but this guide is really about unlocking all the powerful features of the tool, possibly making you orders of magnitude more productive than you were before.
Getting Yourself Oriented
The three most important elements of the IDE are the Editor pane (a), where your code is shown, the Project pane (b), where your project's contents are shown, and the Structure pane (c), where the details of the open object are shown.
Editor Pane: Shows the currently active file, with recently viewed files in the tab bar. IDEA shows the most recently used files in the tabs, and there is seldom a need to manually close tabs. If the maximum number of tabs is reached, then the oldest tab is closed when a new tab is opened. Also, there is seldom a need to save a file; file saving is performed automatically in the background. IDEA supports syntax highlighting for many languages, but is also language aware and shows syntax errors as they occur. Navigate faster by learning these commands: Edit faster by learning these commands:
| Back | Ctrl+Alt+Left | Move back to the last cursor position | |
| Forward | Ctrl+Alt+Right | Move forward to the next cursor position | |
| Next Tab | Alt+Right | Activate tab to the right of the active one | |
| Previous Tab | Alt+Left | Activate tab to the left of the active one | |
| Goto Line | Ctrl+G | Go to a specific line in the active file | |
| Goto Last Edit Location | Ctrl+Shift+Backspace | Go to the position of the last edit |

Toolbar icons are shown throughout this guide, but you'll be much faster if you learn the key bindings. The mouse is slow: stop using it! The IDEA key bindings have received praise over the years, and many believe they are simply better than other IDE's default bindings. If you're switching to IDEA from another tool, consider learning the new bindings rather than loading an alternate key map. The KeyPromoter plugin can help you with this.
Edit faster by learning these commands:
| Move Statement Up | Ctrl+Shift+Up | Moves the current selection up one line in the file |
| Move Statement Down | Ctrl+Shift+Down | Moves the current selection down one line in the file |
| Copy/Paste Line | Ctrl+C / Ctrl+V | When nothing is selected, copy, cut, and paste operate on the entire line |
| Clipboard Stacking | Ctrl+Shift+V | When copying text, IDEA remembers your previous copies. Use Ctrl+Shift+V to paste from a previous copy instead of the most recent clipboard contents |
| Select/Unselect Word at Caret | Ctrl+W / Ctrl+Shift+W | Selects and unselects the word at the caret. Quickly select or unselect the word, statement, block, and method by repeating this action. Experiment to learn how this works differently depending on where your cursor starts |
| Toggle Bookmark | F11 | Sets or removes a bookmark on the current line, which shows as blue in both the left and right gutter |
| Comment/ Uncomment | Ctrl+/ | Comments out current selection, or removes comments from from current selection. This is supported across many languages |
| Column Mode | Ctrl+Shift+Insert | Column mode allows you to select a rectangular fragment of code. Effectively using this can greatly speed up bulk edits on structured data like SQL or csv files |
Project Pane: Shows the contents of the current project, allowing you to view the project as files, packages, or scopes (more about this later). Objects in the project view visually indicate their type with an icon (which also appears on the editor tabs).
Find objects faster by learning what the icons mean:
| Class | Class with main( ) (indicated by green triangle) | ||
| Interface | public | ||
| Abstract Class | protected | ||
| Enumeration | package | ||
| Exception | private | ||
| Annotation | Read Only (indicated by lock) | ||
| Test Case (indicated by red and green triangles) | Not in version control (object name appears in red) | ||
| Final Class (Indicated by pin) | In version control (object name appears black, or blue if edited) |
Properly configuring the Project pane makes it more effective:
| Autoscroll to Source | When an object or method is clicked in the Project pane, that item is opened in the Editor pane. | |
| Autoscroll from Source | When an item is opened in the Editor pane, that item is scrolled to in the Project pane | |
| Show structure | Shows the Structure pane (explained next) as a window nested within the Project pane | |
| Show/Hide Members | Shows the methods and properties of objects within the Project pane | |
| Sort by type | Sorts the Java classes by type from the most abstract to the most concrete |
Structure Pane: Shows the structure of the active file, including methods, properties, and inner classes. Leaving this pane open helps you quickly locate the desired point within a class. Make this pane more useful by tweaking the configuration options:
| Autoscroll to source | Show properties | ||
| Autoscroll from source | Show inherited | ||
| Sort by visibility | Show fields | ||
| Sort alphabetically | Show non-public | ||
| Group Methods by defining type | |||

IDEA provides almost endless amounts of
configuration through the Settings (Ctrl+Alt+S)
window. Use the search box
to quickly find what you need. Just start typing what the
option might be called and the window will highlight to show
which buttons lead to a panel containing that keyword.
Wildcards work too!
Finding What You Need
IDEA sets itself apart from other products by offering incredibly advanced ways to find objects and files within large projects. Mastering the act of finding what you need is key to faster development.
| Goto Class | Ctrl+N | Provides dialog for finding classes. Accepts wildcards, camel case, and package prefixes. For example, "BOS" matches BufferedOutputStream, "Str*Buff" matches StringBuffer, and "java.lang.I" matches all objects starting with "I" in the java.lang package. Use Up/Down error to select the class, and Shift+Up/ Down or Ctrl+Click to perform multiple selections. |
| Goto File | Ctrl+Shift+N | Provides a similar dialog for finding files that are not classes. For example, "*spring*xml" matches any xml files with the word "spring" in the name, and "*Test.groovy" matches any test case implemented in Groovy. |
The navigation bar is a useful alternative to the Project pane. This horizontal bar provides breadcrumb style navigation based on the active file. To navigate to a different package, simply click the + to expand a node higher up in the tree. The navigation bar can be a faster alternative to the Project pane.
Navigating a single class is done through the Structure pane (described earlier) and the file structure popup.
File Structure Popup: (Ctrl+F12) allows quick navigation to methods, fields, and properties. Use the Up/Down arrows to select an entry, or (better) use the search as you type field. Just start typing to narrow the list down. The field provides wildcard and camel case matching. Selecting an entry scrolls the active file to that entry's declaration.
Navigating large object oriented codebases is greatly simplified by learning these commands:
| Ctrl+B / Middle Click | Go to declaration. Navigates to the declaration of the selected instance or type. |
| Ctrl+Alt+B | Go to implementers or overriders of the selected method. Clicking the |
| Ctrl+U | Go to the parent of the selected method or type. Clicking the |
| Ctrl+Mouse Over | Shows the declaration of a local variable or field in a popup window |
| Ctrl+H | Opens the Type Hierarchy pane for the active class. This pane explores the super and subclasses of the current object with a variety of different views |
| Ctrl+Shift+H | Opens the Method Hierarchy pane for the active method. This pane explores the definitions and implementations of the current method. |
| F4 | Jump to Source. Many tool windows display objects within project. Used from a tool window, F4 universally opens the element from the tool in the editor. If you're in the Ant, Hierarchy, or Find window, then F4 will open the selection in the editor pane. |
Finding usages is an important feature of any IDE. Being Java aware, IDEA offers more intelligent searching than simple string matching.
Highlight Usages in File (Ctrl+Shift+F7) takes the current mouse selection and highlights all occurrences of that element in the file. The Editor pane and the right gutter provide visual keys to where the occurrences appear. Use F3 and Shift+F3 to jump to the next and previous occurrence.
Show Usages Popup (Ctrl+Alt+F7) takes the current mouse selection and searches the project for any references made to the field or type. Results appear in an in-editor popup window.
Show Usages in Find Panel (Alt+F7) behaves the same as the Show Usages Popup, except that results are displayed in the Find pane. Learning to operate the Find pane with the keyboard helps you move faster to the intended object.
| Rerun the last find | ||
| Shift+Esc | Close the Find pane | |
| Ctrl+NumPad + | Expand all the nodes in the list | |
| Ctrl+NumPad - | Collapse all the nodes in the list | |
| Ctrl+Alt+Up | Navigate to the previous occurrence | |
| Ctrl+Alt+Down | Navigate to the next occurrence |

Turn on Scroll to Source in the Find pane and use Ctrl+Alt+Up and Ctrl+Alt+Down to quickly cycle through the usages in the main editor window.
Search Structurally (Ctrl+Shift+S) and Replace Structurally (Ctrl+Shift+M) allows searching (and replacing) references using patterns. Again, this is Java aware and done structurally, and is not just text string search and replace. This very rich feature is best explained with an example. Here are the steps to find any factory methods within the project (ie, methods whose name starts with "create"):
- Open Search Structurally (Ctrl+Shift+S)
- Click "Copy the existing template" and select method calls, which is $Instance$.$MethodCall$($Parameter$)
- Click "Edit variables" and select MethodCall
- For the MethodCall variable, enter "create.*" in the Text / Regular Expression. This is the regular expression for the word create followed by any number of other characters
- Click "Find" to open the Find pane showing all the factory methods
Scopes
Often, you only want to search a subset of your project, for instance just the test source or just the production source. IDEA provides Scopes to create smaller filesets used in searching, replacing, and inspections. Some default scopes are "Project Production Files", "Project Test Files", and "Changed Files". Fine tune your searching by defining your own scope, perhaps based on a set of packages. Scopes can also be helpful to speed up searches on large projects. Here are the steps to define a scope:
- Open Settings (Ctrl+Alt+S) and select Scopes (5)
- Click
to create a new scope - Select a package to include from the project browser. Use include and include recursively to broaden the fileset, and exclude and exclude recursively to narrow the fileset
- Save. New Scope is now available for many operations
Finding Documentation
There are many ways to find documentation on objects within your project or dependent libraries. Master the following commands to get the information you need without leaving the IDEA:
| Ctrl+P | Parameter Info. Displays quick information on the parameter types (and overloading options) of a method call when the caret is within the parenthesis of a method declaration |
| Ctrl+Q | Quick Documentation Lookup. Displays Javadoc in a popup for the item at the caret |
| Ctrl+Shift+I | Quick Definition. Displays the source code for the item at the caret |
| Shift+F1 | External Javadoc. Opens an external browser to the Javadoc for the item at the caret. May require setting Javadoc locations within Settings (Ctrl+Alt+S) Project Settings (1) |

Is an option you need buried deep in the menu system? Use Ctrl+Shift+A to bring up the Action finder. Type the name of the action you're looking for and IDEA searches the keymap, menus, and toolbars for the item you need to invoke. Wildcards and camelCase works, of course
Runing and Debuging Your Project
Running and debugging the project is an essential part of any IDE. The easiest way to run an application is to right click the object within the Editor pane and select Run. This works for classes with main() and test cases. You can also right click the object and do the same thing in the Project pane. To run tests in an entire package simply right click the package.
Run targets are managed by IDEA using the Run/Debug Configurations window. If you need advanced settings or VM parameters then use this window to adjust them. Open the window by clicking Edit Configurations within the toolbar's dropdown.
Common run targets can be saved here for future runs.
Running an entry point will display the Run pane. This pane provides diagnostics on the running process. Get the information you need from running processes by learning to use the pane:
| Ctrl+F5 | Run the last target | |
| Pause execution | ||
| Ctrl+F2 | Stop execution | |
| Ctrl+Break | Dump Thread information to a new window or clipboard | |
| Ctrl+Alt+Up | Move Up Stack Trace, opening the Editor pane to the exception location | |
| Ctrl+Alt+Down | Move Down Stack Trace, opening the Editor pane to the exception location |
When debugging an application, IDEA provides a variety of ways to set breakpoints and watchpoints. The easiest is to click the left gutter of the line or method on which you want a breakpoint. More advanced breakpoints are available through the Breakpoints window (Ctrl+Shift+F8).
| Line | Break on the specified line of code |
| Exception | Break when the specified exception is thrown |
| Method | Break when the specified method is called |
| Field | Break when the specified field instance is accessed or changed |
Once stopped on a breakpoint, the Debug pane will open. This pane provides features common to all debuggers, as well as more advanced, uncommon actions.
| Alt+F10 | Show Execution Point | |
| F8 | Step Over | |
| F7 | Step Into | |
| Alt+Shift+F7 | Force Step Into | |
| Shift+F8 | Step Out | |
| Drop Frame | ||
| Ctrl+Alt+Up | Previous Stack Frame | |
| Ctrl+Alt+Down | Next Stack Frame | |
| Alt+F9 | Run to Cursor |

Control what not to step into in Settings (Ctrl+Alt+S) Debugger (G). Exclude certain library classes using the "Do not step into" list, skip simple getters, skip constructors, and more.
Once in the debugger, several panels provide different views of the application state. The Frames Panel shows the current stack frames on the selected thread, and you can navigate quickly between frames and threads. The Variables Panel shows any variables currently in scope. And the Watches Panel shows expanded information on selected variables. When entering variables to watch, autocompletion and smart-type both work.
Expression Evaluation (Alt+F8) allows quick execution of code snippets or blocks. From this window you can reference any in-scope variable of the application. It works a bit like a REPL window open with the current breakpoint's environment, and is most useful in code fragment mode, where you can evaluate multi-line statements.

Drop Frame within the debugger pops the current stack frame and puts control back out to the calling method, resetting any local variables. This is very useful to repeatedly step through a function, but be warned: field mutations or global state changes will remain.
Code Coverage: IDEA offers built in code coverage using the EMMA open-source toolkit. Enable coverage tracking in the Code Coverage tab of the Run/Debug Configurations window. Coverage results appear in several places:
| Package Coverage | Project pane shows % class and % line coverage per package |
| Class Coverage | Project pane shows % class and % line coverage per class |
| Line Coverage | Editor pane left gutter shows red for uncovered line, green for covered line |
Code Coverage Data (Ctrl+Alt+F6) displays a list of previous runs, and selecting an entry shows the coverage data for that run. You can use this to compare coverage between subsequent runs.

Under certain circumstances, code coverage may make your automated tests fail because instrumented bytecode is different than normal bytecode (I've seen this happen when remote CORBA interfaces were invoked). If this happens then simply exclude the affected classes from code coverage within the Run/Debug Configurations window.
Write Less Code
Typing less to produce more is a feature of any modern IDE. IDEA provides top tier code completion support, as well as many other code generation, file template, and refactoring features.
Code Completion: Leveraging code completion is essential to productivity:
| Ctrl+Space | Basic. Completes the names of in-scope classes, methods, fields and keywords. Also complete paths, when appropriate |
| Ctrl+Shift+Space | Smart Type. Displays a suggestion list where the type of the object required can be inferred from the code, such as in the right hand side of assignments, return statements, and method call parameters |
| Ctrl+Alt+Space | Class Name. Completes the names of classes and interfaces. Accepts camel case matching on input |
| Ctrl+Alt+Shift+Space | Complete Word. Similar to Basic. |
| Ctrl+Shift+Enter | Complete Statement. Adds closing punctuation and moves cursor to next line |
| Alt+Slash | Expand Word. Cycles through suggested work choices, highlighting the prototype in the editor |

Confused by all the options? Just start using them and let muscle memory take over. It works.
Code Generation: Letting IDEA infer the code you want to create and drop in the appropriate template can be a huge time saver.
| Ctrl+O | Override Methods... quickly specify a parent method to override and create a stub implementation |
| Ctrl+I | Implement Methods... quickly specify a parent method to implement and create a stub |
| Code->Delegate Methods... | Delegate Methods... creates adapter classes by delegating method calls to member fields. A small wizard guides you through the delegation |
| Ctrl+Alt+T | Surround With... surrounds the current selection with a variety of code wrappers, like if/else, for, try/catch, synchronized, Runnable, and more |
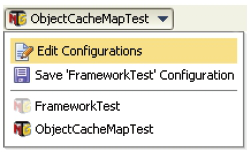
Generate (Alt+Insert) provides its own set of powerful options for code generation:
| Constructor | Select any of your object's fields from a list to create a constructor with the proper parameters and body |
| Getter | Select a field from a list to create an accessor method |
| Setter | Select a non-final field from a list to create a mutator method |
| equals() / hashCode() | Provides a dialog to automatically create equals() and hashCode() methods based on your object's fields |
Live Templates are fragments of commonly occurring code, which can be inserted into the active file in a variety of ways. Learning the live templates will save you many, many keystrokes. A full list is available in Settings (Ctrl+Alt+S) Live Templates (K).
To insert a live template, press Ctrl+J followed by the following keys:
| psf | public static final | thr | throw new |
| itar | Iterate elements of an array | sout | Prints a string to System.out |
| itco | Iterate elements of collection | soutm | Prints the current class and method name to System.out |
| ritar | Iterate elements of array in reverse order | soutv | Prints the value of a variable to System.out |
| toar | Stores members of Collection in Array | psvm | main() method declaration |

Logging live templates are very useful, but many projects use log4J or Commons Logging instead of System.out. Replace the System.out calls with your framework within Settings (Ctrl+Alt+S) Live Templates (K).
Surround with Live Template (Ctrl+Alt+J) will surround the current selection with a block of code. Some of the useful surrounds are:
| B | Surround with { } |
| R | Surround with Runnable |
| C | Surround with Callable |

Use the existing surrounds templates to create your own, like surround with SwingUtilities.invokeLater() or new Thread().start()
Live Template in Multiple Languages: Many live templates exist for languages other than Java. JSP, XML, Spring definitions, and more all exist. Here are some examples of templates from other platforms and toolsets:
| sb | Creates an XML based Spring bean definition |
| sbf | Creates an XML based Spring bean definition instantiated by a factory method (many more Spring intentions exist, too) |
| itws | Generate Axis web service invocation (many more flavors of web services supported, too) |
| CD | Surround with CDATA section |
| T | Surround with <tag></tag> |

The free keymap from JetBrains provides a larger list of live templates. Post the keymap next to your monitor to learn the live templates quickly.
Refactoring: IDEA offers excellent refactoring support. Refactoring is aware of comments, reflection, Spring, AOP, JSP, and more. When the refactoring features are unsure on the safety of a refactoring, a preview mode is invoked so that you can verify the changes. Refactoring works on more than just Java code too: many refactorings exists for XML files as well as other languages. Learning the refactoring tools (and reading the refactoring literature, for that matter) is well worth your time. Here are some of the more common refactorings:
| Rename | Shift+F6 | Renames a package, class, method, field or variable |
| Move | F6 | Moves an entity |
| Change Signature | Ctrl+F6 | Change the method or class name, parameters, return type, and more |
| Extract Method | Ctrl+Alt+M | Moves the current selection to a new method, replacing duplicates if found |
| Inline | Ctrl+Alt+N | Takes a method, variable, or inner class and replaces usages with a unique definition |
| Introduce Variable | Ctrl+Alt+V | Moves the selected expression into a local variable |
| Introduce Field | Ctrl+Alt+F | Moves the selected local variable into a field, prompting you for how initialization should occur |
| Introduce Constant | Ctrl+Alt+C | Moves the selected variable or field into a static final field, replacing duplicates if found |
| Introduce Parameter | Ctrl+Alt+P | Moves the selected local variable into a parameter argument, updating any callers in the process |
| Extract Interface | Moves a set of methods from the object onto an interface, updating callers to reference the interface if possible | |
| Pull Member Up | Move a method from a subclass up to an interface or parent class | |
| Encapsulate Fields | Provides getter and/or setters for the selected field |

Ctrl+Shift+J will join two lines together, which is a sort of shorthand for inline variable.
Improve Your Project's Quality
IDEA's features aren't just about writing code faster, they are also about coding more accurately. Understanding the intentions, inspections, and analysis tools are key to keeping code high quality.
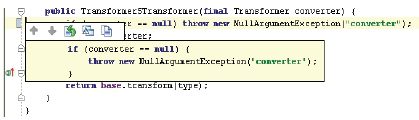
Intentions: Keeps code clean by flagging potential problems in the Editor pane as they occur, and then offers an automated solution. An available intention is signaled by a lightbulb appearing in the left gutter, and the suggested fix can be applied by pressing Alt+Enter. There are several types of intentions:
- "Create from usage" intentions allow you to use new objects and methods without defining them first. Need a new method? Just call it from code and IDEA will prompt you to create it, inferring the parameter and result types. This works for classes, interfaces, fields, and variables. If the missing reference is in all capital letters, then IDEA will even create a constant for you.
- "Quick fix" intentions find common mistakes and makes context-based suggestions on how to fix them. Examples of issues flagged with a quick fix are assigning a value to the wrong type or calling a private method.
- "Micro-refactorings" fix code that compiles but could be improved. Examples are removing an unneeded variable and inverting an if condition.
Some of the intentions or fixes might violate your coding standard. Luckily, they can all be configured within Settings (Ctrl+Alt+S) Intentions (Q)
Intentions and Quick Fixes are indicated by different icons in the left gutter, but in practice there is little need to differentiate between the two:
| Intention available | |
| Quick Fix available |
Inspections: Keeps code clean by detecting inconsistencies, dead code, probable bugs, and much, much more. The near-1000 default inspections can do a lot to enforce common idioms and catch simple bugs across the project. There are way too many inspections to list, but here are examples to provide a flavor of what inspections can do:
- Flag infinite recursion or malformed regular expression
- Catch error handling issues like continue within finally block or unused catch parameter
- Find threading issues like await() outside a loop or non-thread safe access
- Error on Javadoc issues like missing tags or invalid links
Inspections work with many languages and tools beyond the Java language, like Spring, JSF, Struts, XML, JavaScript, Groovy, and many others. The inspection set is highly configurable through Settings (Ctrl+Alt+S) Errors (6). Each inspection can carry its own set of options, and most can be shown as warnings or errors within the IDE. When an inspection violation is shown in the right gutter, Alt+Enter triggers the suggestions to be shown.
Some inspections appear within the Editor pane, while others appear within the Inspection pane when they are run as a batch. To run inspections for a scope, go to Analyze -> Inspect Code in the menu.
Inspection settings can be configured and shared across the team. An "IDE" inspection profile is saved within the user's $HOME directory, but a "Project" profile is saved within the IDEA project file. This means a shared, version controlled project file can be created which contains the team's inspections.

By default, IDEA uses a great set of inspections, but many more options are not turned on by default. Check out http://hamletdarcy.blogspot.com/2008/04/10-best-idea-inspections-youre-not.html to see some non-default inspections you might want to use.
Code Analysis: Provides several different views of dependencies and duplicates within your project. These tools help you modularize your code and find areas of potential reuse. All of the following features are available from the Analyze menu.
The Dependency Viewer provides a split tree-view of your project with a list panel at the bottom. From here you can navigate the dependencies or mark certain undesirable dependencies as illegal. Which analysis feature chosen determines what the Viewer displays:
| Dependencies | Left: Your packages. Right: Packages your code depends on |
| Backward Dependencies | Left: Your packages. Right: Packages that depend on your code. Bottom: Line by line usages |
| Cyclic Dependencies | Left: All of your packages that have a cyclic dependency. Right: The objects that form the cycle. Bottom: Line by line usages |
Not all analysis tools report to the Dependency Viewer, however. Module Dependencies uses a separate panel to display dependencies across all the included modules within the project. This is useful for multi-module projects. Dependency Matrix launches the Dependency Structure Matrix in a separate window. This tool helps you visualize module and class dependencies across the project using a colored matrix.
Locate Duplicates: Finds suspected copy and pastes within
your project or desired scope. Use this to find and consolidate
duplicate modules or statements. The results are displayed in
the Duplicates pane, which ranks the copy/paste violations
and allows you to extract methods on the duplicates by simply
clicking the Eliminate duplicates icon (
).
Work As A Team
IDEA includes many features that allow team members to collaborate effectively.
Version Control (VC) integration exists for Subversion, CVS, Perforce, StarTeam, and Visual SourceSafe. When enabled, local changes appear as a blue bar in the left gutter:
Clicking the blue bar displays some VC options, including a quick line diff (displayed), a rollback of the line changes, or a full file diff in the IDEA Diff Viewer. More VC options are available from the menu or by right-clicking the active editor:
| View History | See revision history for active file with check-in comments |
| View Differences | Launch the side-by-side file comparison window. Merge changes from one file to another, accept non conflicting changes, and more |
| Annotate | Show the user ID of the last person to touch each line in the left gutter |
Local History can be used even if you don't have version control. IDEA keeps track of saves and changes to files, allowing you to rollback to previous versions if desired. Older versions can also be labeled, making it easy to find previous save points.
Shared Project: The IDEA project can be put in version control, keeping all environments up to date as changes are made. Use this guide to the project files to determine what files need to be shared:
| .ipr | Contains project info like module paths, compiler settings, and library locations. This should be in version control |
| .iml | Used in a multi-module project, each module is described by an .iml file. This should be in version control |
| .iws | Contains workspace and personal settings. This should not be in version control |
File Templates: Shared file templates provide a common starting point for frequently typed code. Templates exist, and can be changed, for creating new classes, interfaces, and enumerations. Templates for includes, like a copyright notice, can also be stored and shared, as well as code templates, like default catch statements and method bodies. Modify the file templates in Settings (Ctrl+Alt+S) File Templates (L).
Ant Integration: Many projects use Ant as a common build
script, and IDEA offers integration with it. Features include
syntax highlighting, code completion, and refactorings. Several
inspections and intention settings are also available. Use the Ant
Build Window to run one or several Ant targets. For larger projects
with many targets, use the filter targets
feature to hide
uncommon targets. The Maven build system is also supported.
IDE Talk: IDEA ships with an instant messenger client integrated into the IDE, called IDETalk. Messages can be exchanged with IDEA users on your LAN or anyone with a Jabber account, such as Google Talk. Beyond normal IM features, IDEA provides some developer specific features as well:
| Send Stacktrace | Sends a stacktrace to another user |
| Send Code Pointer | Sends a pointer to a specific piece of code to another user |
| Show Diff with User | Compares your local version of a file with another user's version |
| View Open Files | Requests permission to view the files of another user |
Endless Tweaking Awaits
A massive amount of configuration options are available in Settings (Ctrl+Alt+S). Beyond that, you may wish to experiment with different plugins. Plugins are installed and managed using Settings (Ctrl+Alt+S) Plugins (U). Many plugins exist, adding features like SQL, Hibernate, and Ruby support. JetBrains holds plugin contests annually, so check the site periodically.


Comments
Fafa Saa replied on Mon, 2009/05/04 - 12:41pm
Great Paper as usual (i'm new at Refcardz BTW)
I also agree in saying that you have to master your IDE to be as efficient as possible, BUT all these fancy IDE lack one thing in common:
Consistent and meaninful commands.
Unfortunately even IntelliJ sucks from this point of view.
I strongly object to using muscle memory to learn exotic commands. I prefer using muscle memory to code and develop.
Some examples here:
* Why use "Ctrl+Shift+J" instead of a simple "Ctrl+J" ? (ex vi users know what I mean)
* The refactoring shortcuts are also inconsistent. I remade them all from scratch (and added a Mac version as well) so that that they actually MEAN something. I used the prefixed command for the refactoring so that they all begin with Ctrl + R. When you want to rename a class you can do a Ctrl + R, Ctrl + R for Refactor/Rename
Ctrl + R, Ctrl + M for Refactor/Move
Ctrl + R, Ctrl + V for Refactor/introduce Variable
Ctrl + R, Ctrl + M for Refactor/introduce Constant
and so on...
People should IMHO create their own shortcuts and use them. Even in a team these should be discussed so that everybody will eventually use th same shortcuts without having to learn some weird key combinations...