Getting Started with Firebug
By Chandan Luthra and Deepak Mittal
26,176 Downloads · Refcard 108 of 185 (see them all)
Download
FREE PDF
The Essential Firebug Cheat Sheet
Getting Started withFirebug 1.5
ABOUT FIREBUG
Firebug is a free and open-source tool, available as a Mozilla Firefox extension, which allows debugging, editing and monitoring of any website’s CSS, HTML, DOM and JavaScript. It allows performance analysis of a website and has a JavaScript console for logging errors and watching values. Firebug has many other tools to enhance the productivity of today’s web developer. Firebug provides all the tools that a web-developer needs to analyze, debug and monitor JavaScript, CSS, HTML and Ajax. Firebug includes a debugger, error console, command line, and a variety of useful inspectors.

INSTALLATION
Firebug is developed as a Firefox addon and can be installed on Firefox like all other add-ons. In order to make Firebug work for non-Firefox browsers, there is a JavaScript “Firebug Lite” from Firebug which makes available a large set of Firebug features. Based on your browser version, you can install the corresponding Firebug version.
| Firebug Version | Browser Version |
| Firebug 1.6 alpha | Firefox 3.6 and Firefox 3.7 |
| Firebug 1.5 | Firefox 3.5 and Firefox 3.6 |
| Firebug 1.4 | Firefox 3.0 and Firefox 3.5 |
| Firebug 1.3 | Firefox 2.0 and Firefox 3.0 |
| Firebug Lite | IE, Safari and Opera |
To install Firebug on Firefox, visit http://getfirebug.com and click the “Install Firebug on Firefox” button.
To use Firebug Lite on non Firefox browsers, visit http://getfirebug.com/firebuglite, copy the JavaScript from there and include it in your HTML code.
- Click on the “inspect” button to get into the Firebug’s inspection mode.
- Move your cursor on the page component/section that you want to inspect.
- Click on the page component/section to investigate it.
There is another easy and fast way to inspect an element. Just right click on the page component/section and select “Inspect Element” from the context menu. You can also directly select a DOM node under the HTML tab to view its style, layout, & DOM attributes.
JAVASCRIPT PROFILING
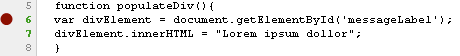
Type the following code in an HTML file, save it and open it up with Firebug enabled Firefox (if Firebug is not enabled then press F12 key to activate it):
<html>
<head><title>Firebug</title>
<script>
function bar(){
console.profile(‘Measuring time’);
foo();
console.profileEnd();
}
function foo(){
loop(1000);loop(100000);loop(10000);
}
function loop(count){
for(var i=0;i</head><body>
Click this button to profile JavaScript
<input type=”button” value=”Start” onclick=”bar();”/>
</body></html>
Click on the button to start the JavaScript profiler. You will see a table generated in the Firebug’s Console panel. Description and purpose of the columns:
Function: This column shows the name of each function.
Call: Shows the count of how many times a particular function has been invoked. (3 times for loop() function in our case.)
Percent: Shows the time consuming of each function in percentage.
Own Time: Shows the duration of own script in a particular function. For example foo() function has none of its own code. Instead, it is just calling other functions. So, its own execution time will be ~0ms. If you want to see some values for that column, add some looping in this function.
Time: Shows the duration of execution from start point of a function to the end point of a function. For example foo() has no code. So, its own execution time is approx ~0ms, but we call other functions in that function. So, the total execution time of other functions is 4.491ms. So, it shows 4.54ms in that column which is equal to own time taken by 3 loop() function + own time of foo().
Avg: Shows the average execution time of a particular function. If you are calling a function one time only, you won’t see the differences. If you are calling more than one time, you will see the differences. The formula for calculating the average is: Avg = Own time / Call
Min and Max columns: Shows the minimum execution time of a particular function. In our example, we call loop() for 3 times. When we passed 1000 as a parameter, it probably took only a few millisecond (let’s say 0.045ms.) and when, we passed 100000 to that function, it took much longer than first time (let’s say 4.036ms). So, in that case, 0.045ms will be shown in Min column and 4.036ms will be shown in Max column.
File: Shows the file name of file with line number where the function is located
JAVASCRIPT DEBUGGING
Firebug allows you to insert break points and step debug the JS code.
<html>
<head><title>Javascript Debugging</title>
<script>
function populateDiv(){
var divElement = document.
getElementById(‘messageLabel’);
divElement.innerHTML = “Lorem ipsum dollor”;
}
</script></head>
<body>
<div id=”messageLabel”></div>
<input type=”button” value=”Click Me!”
onclick=”populateDiv();” />
</body></html>
Now, under the Firebug’s “Script” tab, move your mouse pointer on the line number as shown in the image and click to insert a breakpoint.


Click on the “Click Me!” button to start the execution. You will notice that JS execution is paused at the breakpoint that you set.
You can now step debug the JavaScript by pressing one of these buttons (Continue, Step Over, Step Into and Step Out)under the “Script” tab.
![]()
- Continue (F8): Allows you to resume the script execution once it has been stopped via another breakpoint.
- Step Over (F10): Allows you to step over the function call.
- Step Into (F11): Allows you to step into the body of the another function.
- Step Out: Allows you to resume the script execution and will stop at next breakpoint.
TWEAK CSS ON THE FLY
Through Firebug, you can add, remove and change the CSS properties of inspected elements. This is a most useful feature of Firebug through which one can fix the UI issues rapidly and easily. You can watch the live demo of the changes that you are making in the CSS tab. If you want to add the ‘color’ property of an inspected element:
- ‘Double-click’ on the ‘Style’ panel of HTML tab. A littl e text editor will appear and type ‘color’ followed by a ‘TAB’ key.
- Now the tiny text editor moves to the right side of the ‘color’ property asking you to enter the value (color code) for the property. Provide a value to it and press enter to see the magic.


To disable a CSS rule, move the mouse pointer near to the CSS rule. Click on the ‘do-not’
icon that appears on the left side
of the rule.
To change a specific CSS rule, simply click on the rule, a text editor will appear asking you for the new property or value.
NETWORK MONITORING
Firebug also allows monitoring web pages of your application. A web app might appear to be slow to an end user due to Network latency, Order in which the files are loaded, Number of concurrent request made to server or Browser caching. Firebug’s Net panel allows you to monitor each and every file and request (XHR or HTTP). It generates a colorful graph accordingly on the basis of cycle of a request. Following image is an example of a request:

By default all the expressions and functions that you execute in the command line are relative to the top level window of the page. For example, you cannot invoke any function from Firebug’s command line if that function is defined in an iFrame within a page. Firebug provides a solution for such situation. The cd() method allows you to change the context of the window from main window to the iFrame.
On the Firebug command use the following syntax against a page that has an iFrame
Syntax:
cd(window.frames[0]);
// you can also use the $, $$ or $x selectors for selecting
the iFrame elements.

KEYBOARD AND MOUSE SHORTCUTS
Firebug provides a lot of keyboard and mouse shortcuts in order to make working with Firebug easier and faster. As you become more experienced with Firebug, you will find yourself making more and more use of these shortcuts to accomplish common tasks instead of opening Firebug panel and then clicking on various tabs and buttons.
Global Shortcuts
| Task / Operation | Shortcut |
| Open Firebug Panel | F12 |
| Close Firebug Panel | F12 |
| Open Firebug in Window | Ctrl+F12 |
| Switch to Previous Tab | Ctrl+` |
| Focus Command Line | Ctrl+Shift+L |
| Focus Search Box | Ctrl+Shift+K |
| Toggle Inspect Mode | Ctrl+Shift+C |
| Toggle JavaScript Profiler | Ctrl+Shift+P |
| Re-Execute Last Command Line | Ctrl+Shift+E |
HTML Tab Shortcuts
| Task / Operation | Shortcut |
| Edit Attribute | Click on name or value |
| Edit Text Node | Click on text |
| Edit Element | Double-Click tag name |
| Next Node in Path | Ctrl+. |
| Previous Node in Path | Ctrl+, |
HTML Editor Shortcuts
| Task / Operation | Shortcut |
| Finish Editing | Return |
| Cancel Editing | Esc |
| Advance to Next Field | Tab |
| Advance to Previous Field | Shift+Tab |
HTML Inspect Mode Shortcuts
| Task / Operation | Shortcut |
| Cancel Inspection | Esc |
| Inspect Parent | Ctrl+Up |
| Inspect Child | Ctrl+Down |
| Toggle Inspection | Ctl+Shift+C |
Script Tab Shortcuts
| Task / Operation | Shortcut |
| Continue | F8OR Ctrl+/ |
| Step Over | F10 OR Ctrl+’ |
| Step Into | F11 OR Ctrl+; |
| Step Out | Shift+F11 OR Ctrl+Shift+; |
| Toggle Breakpoint | Click on line number |
| Disable Breakpoint | Shift+Click on line number |
| Edit Breakpoint Condition | Right-Click on line number |
| Run to Line | Middle-Click on line number OR Ctrl+Click on line number |
| Next Function on Stack | Ctrl+. |
| Previous Function on Stack | Ctrl+, |
| Focus Menu of Scripts | Ctrl+Space |
| Focus Watch Editor | Ctrl+Shift+N |
DOM Tab Shortcuts
table cellpadding="0" cellspacing="0">DOM and Watch Editor Shortcuts
| Task / Operation | Shortcut |
| Finish Editing | Double-Click on empty space |
| Cancel Editing | Ctrl+. |
| Autocomplete Next Property | Ctrl+, |
| Autocomplete Previous Property | Shift+Tab |
CSS Tab Shortcuts
| Task / Operation | Shortcut |
| Edit Property | Click on property |
| Insert New Property | Double-Click on white-space |
| Focus Menu of Style Sheets | Ctrl+Space |
CSS Editor Tab Shortcuts
| Task / Operation | Shortcut |
| Finish Editing | Return |
| Cancel Editing | Esc |
| Advance to Next Field | Tab |
| Advance to Previous Field | Shift+Tab |
| Increase Number by One | Up |
| Decrease Number by One | Down |
| Increase Number by Ten | Page Up |
| Decrease Number by Ten | Page Down |
| Autocomplete Next Keyword | Up |
| Autocomplete Previous Keyword | Down |
Layout Tab Shortcut
| Task / Operation | Shortcut |
| Edit Value | Click on value |
Layout Editor Shortcuts
| Task / Operation | Shortcut |
| Finish Editing | Return |
| Cancel Editing | Esc |
| Advance to Next Field | Tab |
| Advance to Previous Field | Shift+Tab |
| Increase Number by One | Up |
| Decrease Number by One | Down |
| Increase Number by Ten | Page Up |
| Decrease Number by Ten | Page Down |
Command Line (small) Shortcuts
| Task / Operation | Shortcut |
| Autocomplete Next Property | Tab |
| Autocomplete Previous Property | Shift+Tab |
| Execute | Return |
| Inspect Result | Shift+Return |
| Open Result’s Context Menu | Ctrl+Return |
Command Line (large) Shortcut
| Task / Operation | Shortcut |
| Execute | Ctrl+Return |
CONSOLE API REFERENCE
| Task / Operation | Purpose |
| console.log(object[, object, ...]) | Writes a message to the console. You may pass as many arguments as you’d like, and they will be joined together in a space-delimited line. |
| console.debug(object[, object, ...]) | Writes a message to the console, including a hyperlink to the line where it was called. |
| console.info(object[, object, ...]) | Writes a message to the console with the visual “info” icon and color coding and a hyperlink to the line where it was called. |
| console.warn(object[, object, ...]) | Writes a message to the console with the visual “warning” icon and color coding and a hyperlink to the line where it was called. |
| console.error(object[, object, ...]) | Writes a message to the console with the visual “error” icon and color coding and a hyperlink to the line where it was called. |
| console.assert (expression[, object, ...]) |
Tests that an expression is true. If not, it will write a message to the console and throw an exception. |
| console.dir(object) | Prints an interactive listing of all properties of the object. This looks identical to the view that you would see in the DOM tab. |
| console.dirxml(node) | Prints the XML source tree of an HTML or XML element. This looks identical to the view that you would see in the HTML tab. You can click on any node to inspect it in the HTML tab. |
| console.trace() | Prints an interactive stack trace of JavaScript execution at the point where it is called. |
| console.group(object[, object, ...]) | Writes a message to the console and opens a nested block to indent all future messages sent to the console. Call console.groupEnd() to close the block. |
| console.groupCollapsed (object[, object, ...]) |
Like console.group(), but the block is initially collapsed. |
| console.groupEnd() | Closes the most recently opened block created by a call to console.group() or console. groupEnd() |
| console.time(name) | Creates a new timer under the given name. Call console. timeEnd(name) with the same name to stop the timer and print the time elapsed. |
| console.timeEnd(name) | Stops a timer created by a call to console.time(name) and writes the time elapsed. |
| console.profile([title]) | Turns on the JavaScript profiler. The optional argument title would contain the text to be printed in the header of the profile report. |
| console.profileEnd() | Turns off the JavaScript profiler and prints its report. |
| console.count([title]) | Writes the number of times that the line of code where count was called was executed. The optional argument title will print a message in addition to the number of the count. |
| console.table() | Allows output of tabular data in console. E.g. var myTable = new Array(3); for (var i=0; i<3; i++) myTable[i] = [i+1, i+2, i+3, i+4]; console.table(table); |
COMMAND API REFERENCE
| Command | Purpose |
| $(id) | Returns a single element with the given id. |
| $$(selector) | Returns an array of elements that match the given CSS selector. |
| $x(xpath) | Returns an array of elements that match the given XPath expression. |
| dir(object) | Prints an interactive listing of all properties of the object. This looks identical to the view that you would see in the DOM tab. |
| dirxml(node) | Prints the XML source tree of an HTML or XML element. This looks identical to the view that you would see in the HTML tab. You can click on any node to inspect it in the HTML tab. |
| cd(window) | By default, command line expressions are relative to the top-level window of the page. cd() allows you to use the window of a frame in the page instead. |
| clear() | Clears the console. |
| inspect (object[, tabName]) |
Inspects an object in the most suitable tab, or the tab identified by the optional argument tabName. The available tab names are “html”, “css”, “script”, and “dom”. |
| keys(object) | Returns an array containing the names of all properties of the object. |
| values(object) | Returns an array containing the values of all properties of the object. |
| debug(fn) | Adds a breakpoint on the first line of a function. |
| undebug(fn) | Removes the breakpoint on the first line of a function. |
| monitor(fn) | Turns on logging for all calls to a function. |
| unmonitor(fn) | Turns off logging for all calls to a function. |
| monitorEvents (object[, types]) |
Turns on logging for all events dispatched to an object. The optional argument types may specify a specific family of events to log. The most commonly used values for types are “mouse” and “key”. The full list of available types includes “composition”, “contextmenu”, “drag”, “focus”, “form”, “key”, “load”, “mouse”, “mutation”, “paint”, “scroll”, “text”, “ui”, and “xul”. |
| unmonitorEvents (object[, types]) |
Turns off logging for all events dispatched to an object. |
| profile([title]) | Turns on the JavaScript profiler. The optional argument title would contain the text to be printed in the header of the profile report. |
| profileEnd() | Turns off the JavaScript profiler and prints its report. |
STRING FORMATTING
All of the console logging functions can format a string with any of the following patterns:
| Symbol | Type/Purpose |
| %s | Formats the object as a string |
| %d, %i, %l, %f | Formats the object as a number |
| %o | Formats the object as a hyperlink to the inspector |
| %1.o, %2.0, etc.. | Formats the object as an interactive table of its properties |
| %.o | Formats the object as an array of its property names |
| %x | Formats the object as an interactive XML markup tree |
| %1.x, %2.x, etc.. | Formats the object as an interactive XML markup tree with n levels expanded |
*If you need to include a real % symbol, you can escape it with a backslash like so: “\%”.


Comments
Pedro Lagonell replied on Mon, 2011/07/18 - 7:06am